As sad as it may seem, these days no one seems to have enough time to look at things in detail, from text language to finding information, we want to know what we need to know as quickly as possible.
Maths has been doing this for some time now with data presentation and interpretation an important skill; knowing how to present the information clearly and how to access it quickly. In this set of activities, we look at the different forms of data presentation and which is most appropriate for the information being presented.

Activity One – Pictograms
Suitable for Years 1 to 6
Learning Objectives:
- To be able to accurately read information from a pictograph using a symbol key
- To be able to construct a pictograph from collected data and define an appropriate symbol key
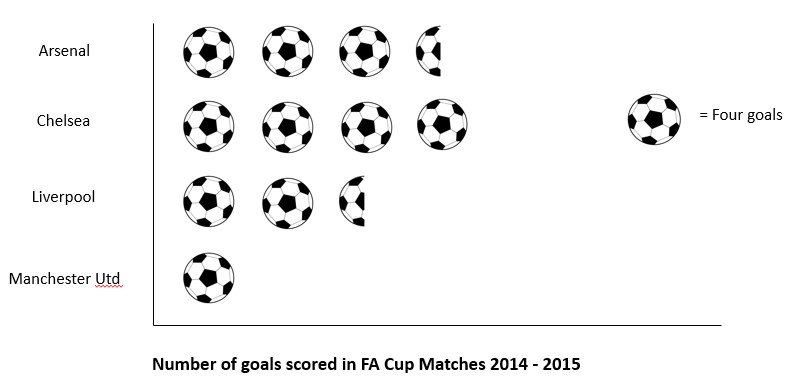
Copy the pictograph above onto your interactive whiteboard and hide the title of the pictograph. Ask the pupils if they can tell you what information is being displayed here without knowing the title of the graph? Reveal the title to show them if they were correct.
Ask them how they knew without being told and you’ll hear them say that they assumed the footballs meant goals and with the teams listed, it must be the number of goals scored in a particular timeframe.
Ask them to rate the effectiveness of the pictograph in terms of ease of access to the information, then check by asking them to show you their answers on a piece of paper or individual whiteboards.
Ask them to define what pictures could be used to show the number of people who attended school events. What would their key represent? Now try other pictograph subjects and encourage them to define a key for the subjects; traffic passing school, amount of fruit eaten each day in school etc.
Now get them to collect data of their choice (younger ones may need prompting here) and help them to construct their own pictographs. Don’t let them title the pictograph yet and see if the class can guess what it represents.
Activity Two – Pie Charts
Suitable for Years 3 to 6
Learning Objective:
To be able to accurately read information from a pie chart using knowledge of fraction
To be able to construct a pie chart from collected data and define appropriate segments
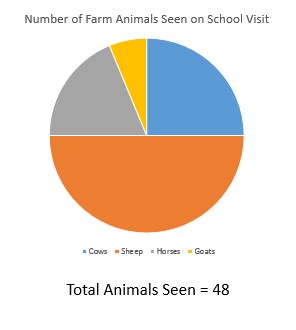
Copy the pie chart onto your interactive white board and again, conceal the title. Ask the pupils if they can tell you what the pie chart represents. Now, given that the total number of animals is 48, can they tell you how many of each were seen on the school visit?
How easy did they find accessing the information? Was it as clear as the pictograph? Ask them now if they can tell you what skills are needed to be able to construct a simple pie chart. Remind them that they used them to be able to work out how many of each animal there were. For younger children and the less able, give them circles of paper to work from and ask them to construct a pie chart for the following information:
Favourite break time snacks
| Snack | Number of Pupils |
| Fruit | 20 |
| Cereal Bars | 10 |
| Sandwich | 5 |
| Crisps | 5 |
For the older and more able, give them a pair of compasses and a protractor and get them to construct a pie chart as follows:
| Snack | Number of Pupils |
| Fruit | 32 |
| Cereal Bars | 8 |
| Sandwich | 20 |
| Crisps | 4 |
You can tell them that a way to avoid having to calculate the size of the most difficult segment is to leave it to last and it will be the remaining space on the pie chart if the rest are accurate. As an extension, you could show the pupils how to construct pie charts using Excel’s chart tools.
Activity Three – Bar Charts
Suitable for Years 2 to 6
Learning Objective:
To be able to accurately read information from a bar chart using the scale
To be able to construct a bar chart from collected data and define an appropriate scale
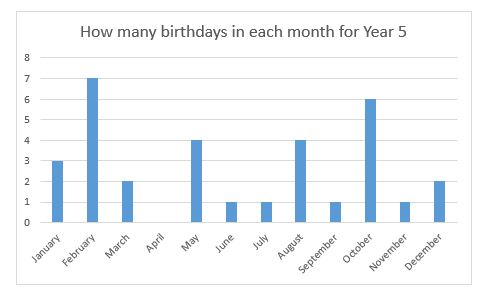
Display the bar chart above on your interactive whiteboard, obscuring the title and once more, ask the pupils if they can tell you what they think it represents. It’s a little harder this time but the pupils should still work it out.
How is the amount of data for each month represented and how does this compare to the pie chart and pictograph. Consider whether pie charts and pictographs would have been suitable for this data and to give their reasons.
Now ask them to collect data from another class on any topic they like and to present it as a bar chart. Can they present it as a pie chart and a pictograph and say which was easiest to construct and which presented the data most clearly.
Activity Four – Infographics
Suitable for Years 3 to 6
Learning Objective:
To be able to accurately read information from an infographic
To be able to construct an infographic from collected data, choosing appropriate graphics and scale
Infographics are the new learning tool in a world that is fixed on easily accessible and fun information presentation.
Search the internet for suitable infographics and show them to the pupils. Ask them to say how they present information and how they are different from pictographs, pie charts and bar charts. Could the information they have used so far could be presented as an infographic? Allow them to choose one set of data they have used so far and design an infographic using it.
Finally, complete a wall display showing all the different forms of data presentation and perhaps add a tally chart to collect data on what the rest of school thinks about data presentation!