Students will be used to solving algebra equations but in this activity, we will consider how algebra can help us to solve maths puzzles such as sequences.
Suitable for:
Year 4 to Year 6
Learning Focus:
Represent a problem as an algebraic equation
Use graphs to help solve algebraic equations
Activity One:
Write the following number sequence on the board:
2, 4, 6, 8, 10, 12, 14
Ask the pupils if they can say how the sequence is developed. They are likely to say that it’s the two times table or that 2 is added to the previous term. Now show them how this can be represented by an algebraic equation:
b = a + 2
where a and b are consecutive terms in the list
Ask them what the equation would be for the 3x tables or the 5x tables.
How would they write the equation if the numbers were getting smaller in the sequence?
Now write the following trickier number sequence on the board:
2, 3, 5, 9, 17, 33, 65
Can they work out how each number in the sequence is derived?
It could be said that the difference between each term is doubling or that the term is doubled and 1 subtracted from it to form the next term.
This could be represented as equations as follows:
2(b-a) + b = c
Where b and a are consecutive terms in the series and c is the next term.
Write these questions on the board, asking them to find the next two terms but also write the equation they would use to find them…
128, 64, 32, 16, _ , _ ,
1, 4, 9, 16, 25, 36, _ , _ ,
1, 2, 4, 7, 11, 16, 22, _ , _ ,
Activity Two:
Graphs can be used to find information based on simple algebraic equations. For example converting currency exchange rates or for changing miles per hour into kilometres per hour or gallons into litres.
Show the pupils this example:
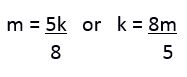
Five miles per hour is the same as eight kilometres per hour so to convert between each we can use the formulae:
By giving values to k in the first equation we can find out what m is and plot a graph of the mph to the kmph. Now, rather than use the equation, we can simply read off figures from the graph.
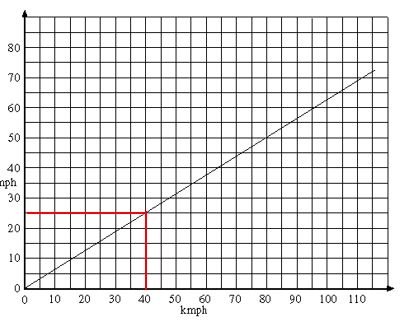
You can see from the graph that 40 kmph is the same as 25 mph.
You can use simple examples such as the £ to $ exchange rate of £2 equalling $3 or even invent your own ratios.
Activity Three:
You can extend the previous activity further by using it to solve algebraic equations with two variables:
Take the equation 2x + 3 = y
To graph this, we need to give a value to x and then calculate y. This is best done using a table as follows:
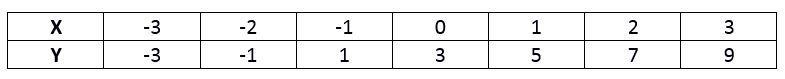
By drawing the line using the coordinates in the table you can also find the values for other variables
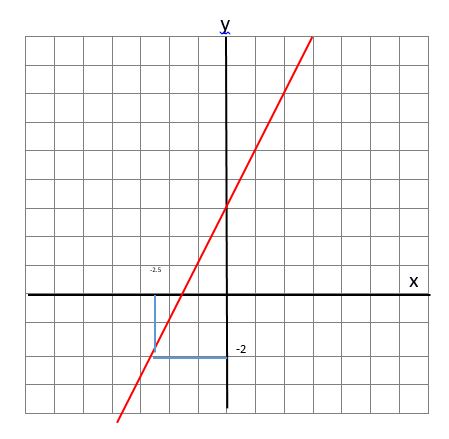
So we can see from the graph that when y = -2, x = -2.5
Now write the following equations on the board and ask the pupils to draw the graph and then write down other pairs of variables.
x + 2 = y x – 1 = y 3x + 3 = y